From satellite qualification to pioneering downstream services in communication, navigation and earth observation, we offer a comprehensive range of services.
Our geospatial solutions include AI-supported geodata analysis, environmental monitoring, GIS and photogrammetry. We support you in mapping and analysing climate change impacts, as well as in developing future scenarios for disaster management and climate adaptation. We develop customised GIS and platform applications for the efficient design of business processes and user-friendly access to information.
Presentation of Elke in detail
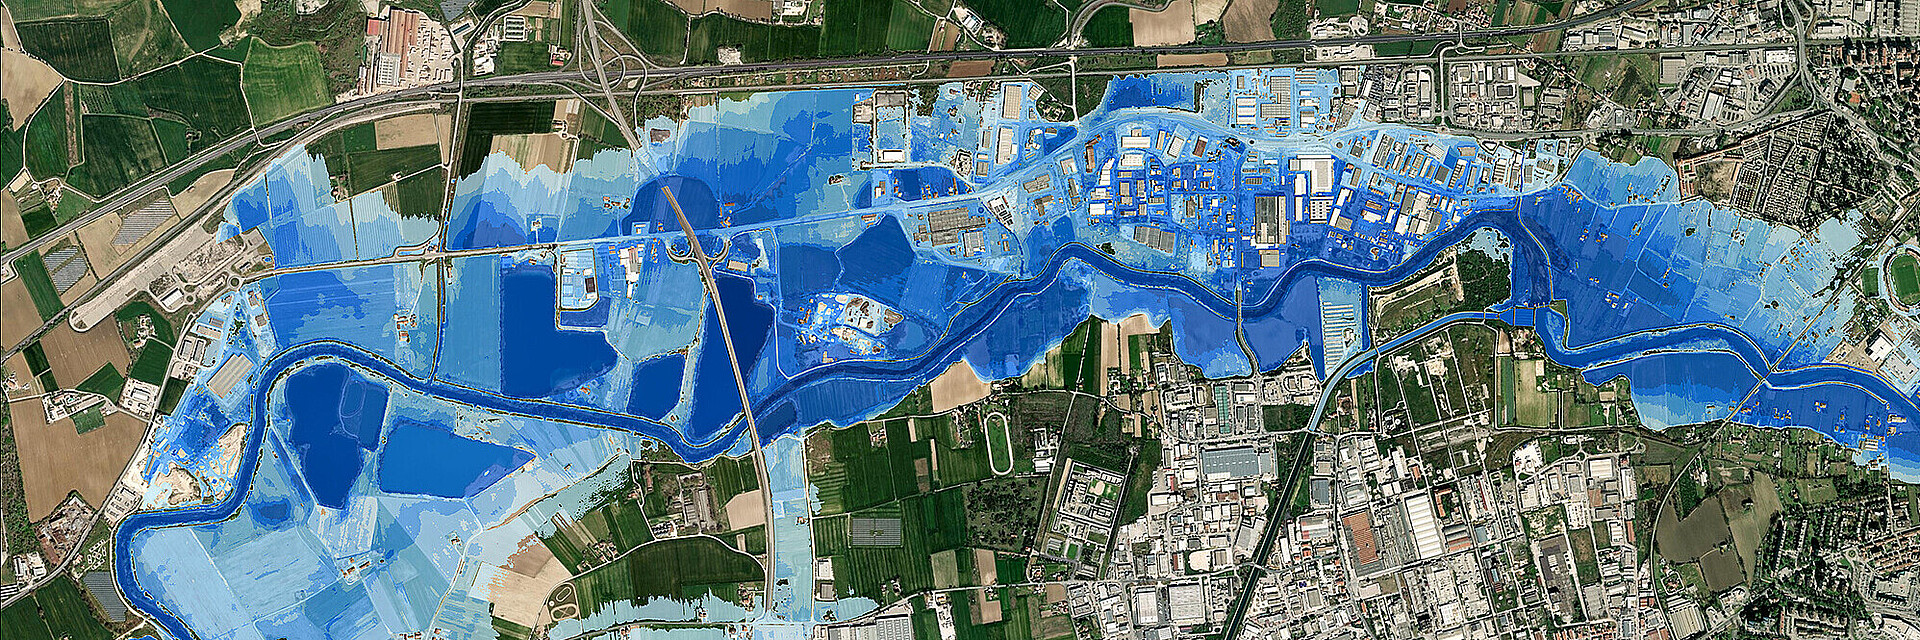
“Same same, but different” – A Cross-country approach to enrich locations of energy asset with hyper-localized information on climate risk
Session B.03.08: Earth Observation in support of the energy transition - PART 2 (Link)
23.06.25 | Hall L3 | Session start: 16:15Abstract: Environmental hazards, either natural, human-made or climate-related, have significant implications for ecosystems, human health and livelihood, and thus on the economies. Natural hazards such as earthquakes, floods, hurricanes, and wildfires, are difficult to predict or behave region-specific. Human-made land exploitation like urban expansion, mining, deforestation, often increase the downstream impact of the afore mentioned events Both need therefore be considered specifically in the geo-spatial and socio-economic context of a region. Within the ESA Global Development Assistance Program (Clean Energy) a tool was elaborated to tackle such challenges and to provide highly granular information, linking to energy infrastructure assets and any related site-specific decisions to be made. In cooperation with the World Bank team, various hazards and their impact on energy infrastructure were investigated, specifically relevant for the country of Bangladesh. The country is one of the most vulnerable countries related to climate change, as it is prone and exposed to extreme events such as flooding, landslide, extreme winds, and droughts. During an agile period of discussions and prototyping, the current best-practice implemented at WB was reviewed, the needs of economists and local stake holders was discussed, and likely realisation strategies were prioritised. To examine the transferability of the approach, to better apprehend the geospatial specifics and how they impact the analyses/ questions asked by the users, the showcasing was extended in location and thematics to other sites. Whereas in • Bangladesh, hazards are fundamentally linked to significant oversupply vs. temporary lack of water, require • large areas of Sub-Saharan Africa with droughts and contrasting severe rain events a different strategy of combining geospatial analysis with Earth Observation. • Agriculture areas in Latin America regularly exposed to the El-Niño/ El-Niña phenomena, experienced severe heat waves over the last years, potentially intensified by the rapid reduction of rain forest, resulting in a long-term climatic change with extreme droughts and wide spreading fires. • The Jamali islands (Indonesia) are densely populated, and the installation of energy assets competes with other local demands. Here, flood related hazards, earthquakes caused by the Sunda Arc volcano range and subsequent landslides are the focal point of analysis. The derived hazard and exposure maps, as well as related analytics (visual, geospatial, statistics) are designed and provided for multiple user groups. Thus, multiple scales and associated task on user side can be served with generic indicators, contributing to decision-based funding. This extensive, geographically and thematically extended use case and developed tool addresses the assessment of the energy infrastructure exposure to hazards by estimating the relevant climate and disaster risks accordingly. On the side of World Bank, own platforms and standardised data pools are already available presenting ‘at hand’ global data, monitoring and reporting national specifics on a draft level (see World Bank’s Climate Knowledge Portal). The services of the GDA Clean Energy team consider these analyses whenever possible and suitable. Going further into detail, the developments of the GDA Clean Energy prepared extended solutions with regard to a more detailed scale, considering most recent and freely available data sets and imagery. Thus, it provides answers, supporting the exposure assessment of energy-related assets to natural hazards and extreme events responding to most recent developments. The multiple hazard data base, combined with thematic layers (e.g. land cover) is able to respond to the full range of requests - national to hyper-localised. With this it becomes of high interest to engagements exceeding the energy sector. It is in particular to mention that the results are of interest to the World Bank Group’s Country Climate and Development Reports (CCDRs), a core country specific diagnostic, integrating climate change and development specifics. The developments within GDA was identified as important scalable and transferable tool, ready to feed into the statistical and geospatial baseline of this report providing financial assistance towards sustainable development in support to green transition.
Presentation of Kristin in detail
Connecting people – EO as a driver for knowledge-based finance decisions for multiple infrastructure projects in Uganda
B.01.02: Earth Observation accelerating Impact in International Development Assistance and Finance - PART 2 (Link)
24.06.25 | Room 1.85/1.86 | Session start 16:15Abstract: The North of Uganda is, like few other regions, impacted by a significant influx of refugees from neighbouring and conflicted countries, becoming part of the population on long term. Latest UN numbers of November 2024 count over 1.7M refugees hosted in the whole country. Within this setting, existing infrastructure serving the social and economic needs demands to be broadened. The World Bank is engaging in the region to extend and facilitate the safe access of the local communities to schools, markets, hospitals and other social services to develop a safe and viable livelihood and to foster economic growth. To make these investments sustainable and advantageous for most people possible is reflected by various Sustainable Development Goals, i.e. SDG3 Good Health and Well-being, SDG4 Quality Education, SDG5 Gender Equality, SDG11 Sustainable Cities and Communities. Sustainable investment requires comprehensive knowledge of the status-quo and dynamics in the focus region. The consideration of input data, in best case ranging from an up-to-date situation picture, prior developments within the region and the environmental pre-conditions, greatly influence the impact an investment can achieve. Economists are widely using statistical information during the project planning phase, often linked to administrative units and combine these with on-site investigations once the investment projects enter the preparation phase. Within the ESA GDA - Transport and Infrastructure project, collaborations between the GDA team and the WB counterparts started to emphasise the use of highly granular EO data and information, as well as raise awareness of the potential this data has on the decisions-making process. The IFI activities are focused on sustainable development for the local population, peacebuilding, as well as the integration of displaced persons into the communities, while addressing long-term needs for social stability and economic growth. The presented results support multiple World Bank teams and projects in Uganda, where decision making processes depend on reference data and statistics that overlap with reality to a limited extent. While national statistics represent the local population, UN-based statistics focus solely on monitoring refugee camps. The baseline for the analysis outlined here is DLR´s World Settlement Footprint (WSF) tracker derived by jointly exploiting Sentinel-1 and Sentinel-2 imagery, which systematically outlines the settlement extent growth with 10m spatial resolution at 6-month pace from July 2016 to (so far) July 2024. Whereas statistics keep local population and refugees separate, the inclusive WSF supports the understanding of the established refugee camps (location and extent) and their impact onto the region over time. One main objective of this engagement is to provide key figures related to the distribution and categories of schools and their adequate accessibility to the pupils (distance and time, safety). The team was fortunate to benefit from the latest Uganda Census 2024, conducted by the Uganda Bureau of Statistics, providing details on population structure. Linking the latter to the settlement extent estimates local demand and deficiencies, considering in-depth aspects responding to age structure and gender, as well as the potential population growth within the upcoming years. Another WB project that is addressed here emphasises on the expansion and extension of the road network to support local transport, and to lower barriers to exchange and connect within and between the cities and refugee camps. The geospatial analysis conducted, provides a valuable input for planning impactful investments. These may be related • to encouraging economical preconditions by supporting and simplifying public transport in order to emphasize mobility of people (labour force) and goods, or • to site selection best suitable for new schools respectively the extension of existing schools, on positively influencing public transport (extension and densification as a commuter medium), targeted investments for a safer transport infrastructure (e.g. traffic light or speed reduction along pupils’ commuter lines) and preventing in parallel an extension of the road to prevent more dangerous routes to school. The examples shown include and combine open information layer considering their advantages and limitations, conjoin these with most recent EO data and geospatial analytics, to retrieve highly transferable solutions. Although approaches are kept generic in a first step, their ability to be consecutively tailored to various specifics is inevitable. Tailoring hereby ranges from (a) the thematic addressed (e.g. schools, hospitals, social services, markets, or other commercial centres), to (b) the response to the local dynamics (urban growth characteristics), and to (c) the enrichment by additional information (such as data collected via citizen science, e.g. counting bus customers, road conditions, etc). The engagement process with the bank teams as an agile development approach enables both sides to tackle new ideas and options within the development process. It allows the service provider to better comprehend the challenges of the bank teams & local stakeholders, and to respond appropriately to their needs (different service- combination, scale and information depth), keeping in mind the overarching aspiration to achieve transferable, and scalable results.
Our Contributions to the Poster Sessions
Ol’ Man River – Development and Growth by Decreasing Negative Impacts
Session: B.01.02 - POSTER - Earth Observation accelerating Impact in International Development Assistance and Finance (Link)
Kristin Fleischer, Mareyam Belcaid (Presenter), Elke Kraetzschmar
IABG24.06.2025 | X5 – Poster Area
Abstract: The Amazon basin habitats the world’s most biodiverse forest and has a share of 50% of the remaining rain forest worldwide. By covering about 35% of the South American continent in nine countries, the regions host further superlatives such as longest rivers and largest volume of water of river system in the world. Beyond that, its importance as a stabilising factor of the World’s climate is undeniable. But the complex and fragile ecosystem is under stark pressure. Although scarcely populated with a few larger cities and scattered settlements, the living and working environment is expanding. One of the biggest challenges is the deforestation in favour of bioeconomic products & services such as mining, lumbering, agriculture, and livestock, one of the results of the ever increasing global demand and hunger for goods. On top of that, the increasing pressure induced by climate change is taking its toll. Rainy seasons are shortened, and periods of severe drought accompanied by wildfires are more frequent, to name only a few. Despite the ecological richness of the region, local communities and people often life in poverty and basic needs are unmet. The Global Development Goals should serve as a guiding principle for the development of the region. Connectivity as well as access to markets and social services is key for both - bioeconomic products & services and the local population. The World Bank is investing to answer one of the main questions: how can access be gained and connecting networks be developed with simultaneously decreasing the negative impact. The WB team is conducting an analysis of infrastructure gaps by assessing their vulnerability to climate risk in order to support bioeconomy value chain, and supporting greater opportunities for higher incomes, increased productivity, and economic participation for the people of the Amazon Region. Focus areas lie on the • Identification of key infrastructure bottlenecks to productivity growth; • Identification of connectivity and access challenges and potential solutions to improve access to basic services and improved welfare; • Designing a sustainable infrastructure development roadmap for transport connectivity, energy access and digital connectivity. Waterways and related assets such as harbours are a declared alternative to common road networks in the Amazon region. The GDA Transport and Infrastructure team supports the World Bank in their data driven approach for infrastructure planning by enhancing waterway insights through the state-of-the-art analysis of satellite imagery. Only a detailed knowledge of the status quo of the hydrological network and its exposure to seasonal and climate change influences allows to tackle the identified connectivity challenges in an appropriate manner. In close cooperation with the WB team, the developments are focusing on the following four topics. (1) Hydrographic inventory: understanding the accessibility of areas by and the navigability of rivers is essential. Open or governmental data lacking thematic level of detail and geometric accuracy. Information such as network density, river width, sandbanks, or obstacles is widely missing. The inventory is based on Sentinel 1 and Sentinel 2 satellite image data of the dry season. It follows a two stage approach: in a first step a remote sensing analysis of the data is conducted, where the classification considers various indices and spectral bands of the sensor. To densify the results and improve the detectability of narrow rivers and close gaps in the network, advanced technologies such of super resolution and AI is incorporated in a second step. (2) Water course change: the analysis provides the comparison of the water extent, showing changes between two consecutive years from 2019 to 2023. The analysis of seasonal or drought induced changes as well as geomorphological variation (e.g. sedimentation) help to assess their influences on the navigability. (3) River Flood Modelling: helps in assessing flood risks, planning flood management strategies for e.g. harbours, and understanding the hydraulic behaviour of the river system under different flood conditions and its affects on navigability. (4) Boat detection: to determine the number of boats traversing a specific stretch of river, providing valuable insights into the connectivity of access routes. By quantifying the traffic of boats, key waterways and harbours that serve as critical transportation corridors are identified. Additionally, size of boats provides information of river navigability. As the Amazon region is vast it is clear that manual approached as well as the use of VHR image data or even field missions can only be conducted locally, but are impossible to be applied on a larger scale. Otherwise, costs and manpower are exceeding every benefit. EO data of ESA’s Sentinel fleet combined with automatic approaches for information extraction are enrolling its full potential here. The approach provides an opportunity for the WB team to cover large areas and close the current information gaps on their way to a sustainable and targeted infrastructure planning along the hydrological network. It is the aim to build on the developments exemplary showcased in the areas of Colombian Leticia and Brazilian Tabatinga, and to transfer these to other hot spot areas of development that demand sustainable interactions throughout the whole Amazone region.
Zoom In – A Cascading Solar Potential Approach
Session: B.01.02 - POSTER - Earth Observation accelerating Impact in International Development Assistance and Finance (Link)
Elke Kraetzschmar (Presenter), Kristin Fleischer
IABG24.06.2025 | X5 – Poster Area
Abstract: Access to energy is identified as one of the basic needs towards a decent life with better chances (SDG 7). Whereas in Europe, main initiatives concentrate on implementing the European Green Deal and related national policies, providing access to energy is still ongoing in other parts of the world and often handled in a more pragmatic way. Access to continuous and reliable energy as guarantee for economic growth remains a challenge in many fast growing and rapidly densifying urban agglomerations (Africa, SE-Asia). Concerning a well-designed energy infrastructure, cities are less managed. Understanding the dissemination grid is crucial. Private initiatives and investors provide access to electricity, thus the urban fringe is often intermingled with off-grid energy units, such as mini-grids preferably run by diesel generators. Few houses have Photovoltaic (PV) systems installed on their rooftops. Air quality is critical, space is limited, and open suburban regions convert to densely populated places within a few years. In this common setting, International Financial Institutions (IFIs) engage in supporting the transition towards sustainable solutions to fulfil SDG 7, serving the ranging needs within urban agglomerations and in rural areas. EO data can act as the overarching element by providing a better understanding of regional patterns and the urban dynamics, and thus in tailoring the financial support accordingly. Focus is drawn to find best fitting, affordable and sustainable solutions, may this be solar rooftop solutions, hydropower, wind energy, or biogas. Within the Global Development Assistance Project on Clean Energy (GDA-CE), the team sketched multi-scale approaches and linked these to sites of ranging extent as demanded by the WB projects. Key questions to define the analysis approach are • What area size needs to be covered and what is the best fitting scale of analysis? • What is the purpose of the analysis & the respective user group and how high is the willingness to pay? • Which input and analysis data need to be considered? The analysis of the cardinal questions often reveals, that the well-know and very detailed roof-top based solar potential analysis can be over-the-top respectively is less purposeful, and even a waste of money. To avoid a mis-alignment in effort and suitability of results, the team introduced five scales of analysis serving different decision making levels and local user groups. 1) Global scale: low to medium-resolution global information layers for high-level decision makers. Usually used to understand the pan-continent situation or to conduct a country comparison based on long-term average data. A classic example is hereby the Global Solar Atlas. 2) National scale: Whereas national solutions in European countries follow bottom-up approaches due to a rich local data environment, developing countries mainly lack detailed information layers, forcing to set-up alternative top-down approaches for a first country-wide solar potential analysis. The advantage lies in a significant lower effort needed, both in terms of budget and man-power. The GDA-CE team developed and conducted a solar potential analysis on national level of Armenia. The high-resolution analysis benefited from ESA’s Sentinel-2 imagery providing a sufficient retrospective timeline and most recent terrain data. Yet, the level of detail of the results goes beyond the commonly used global solar atlas. 3) Regional scale: While still relying on open EO and geospatial data of high resolution, the number of input information layer for the analysis increases and thus does the thematic level of detail. Additionally, regional specificalities as well as user data are considered. The team is currently at the start to implement this approach, discussing most urgently needed regions in West Africa with the WB partner. 4) Local scale: Latest at local scale the solar potential analysis enters the VHR world, as the level of detail switches to building footprint level. The GDA team conducted a solar rooftop analysis based on VHR stereo data for Yerevan the capital of Armenia, emphasising on common challenges when working with spaceborne data. These proof sufficiency for the first stage of dimensioning potential investments. When characterising the urban structures regarding their suitability for roof-top installations itself, generic understanding of building orientation, types & sizes, distribution, and specific roof-top characteristics (obstacles, age, sub-rooftop level) is of interest. 5) Implementation scale: More detailed aerial flight planning is considered as far too costly and gets rather replaced by local drone flights once investment planning reaches engineering level (static). Sub-city or even building level analysis is linked to on-site visits. Here, the team already conducted detailed planning including engineering & construction specific skills in Germany. The presentation aims to provide a wrap-up of the reasonability of the multi-scale analysis within different project planning phases and user perspectives. The different approaches were showcased in multiple locations (cities and rural areas). It supports the engagement of the IFIs, being aware of limitations of regional scale vs. Benefits of receiving a most recent situational picture, linked to timeline and understanding the contextual options often surpasses this and build the base for a detailed trade-off analysis. Identifying the needed and most suitable scale of analysis is the foundation for the subsequent selection of data and analysis methodology. The choice directly implies a certain financial scheme necessary on IFI side (driven by data costs and high ration of manual work). Depending on the size of the location of interest, costs are prone to explode rapidly when choosing the supposedly best solution, while lacking knowledge of cost-efficient alternatives. The developed decision tree aims to guide the IFIs and user to tackle their need in the best fitting, and in cases pragmatic, manner.
EVIDERI: EO as Evidence in “Crime Against Humanity” Investigation Process
Session: E.02.01 - POSTER - Advanced SAR processing techniques for security and safety applications (Link)
Giulia Tessari 1(Presenter), Felicitas Bellert 2, Kristin Fleischer 2, Mirko Lapi 1, Alix Leboulanger 3, Marcello Moretti 1, Paolo Pasquali 1, Michele Rubino 1
AFFILIATIONS:1. sarmap SA • 2. IABG • 3. JANES26.06.2025 | X5 – Poster Aera
Abstract: The last century witnessed horrific crimes committed during various conflicts, many violating international law. The International Criminal Court (ICC) is responsible for investigating, prosecuting, and trying individuals accused of severe crimes, including genocide, crimes against humanity, war crimes, and aggression. Effective investigations require solid evidence. The EVIDERI project, founded by ESA, aims to demonstrate the importance of integrating Earth Observation (EO) data with Open-Source Intelligence (OSINT), to enhance the value of the information extracted and utilize it as legal evidence in international crime investigations. Based on the ICC Requests for Information (RFIs), the EVIDERI team conducted case studies to develop workflows for creating evidentiary products. The approach used diverse data types, including earth observation data like optical and Synthetic Aperture Radar (SAR), combined with contextual information such as event monitoring and conflict timelines. The project involved rigorous analysis, validation, and qualification of the collected data. Both medium and high-resolution EO data were analyzed. OSINT information on specific events of interest helped narrow the time interval for analyzing EO data. Meaningful products were provided to effectively address the core questions of the RFI. Two case studies will be presented, focusing on creating a common structure for EO and non-EO data and identifying appropriate solutions to integrate OSINT and GEOINT, enabling link analysis across diverse data sources using common keys such as date, location, and/or names, events descriptions and metadata.

Wie können wir Ihnen helfen?
Bitte füllen Sie das Formular aus, wir setzen uns umgehend mit Ihnen in Verbindung.
An dieser Stelle finden Sie Inhalte eines Drittanbieters, die Sie mit einem Klick anzeigen lassen können.
Mit dem Laden des Formulars können personenbezogene Daten an den Drittanbieter übermittelt werden. Mehr Informationen finden Sie in unseren Datenschutzbestimmungen.